


Editorial Integrity
Making informed real estate decisions starts with having the right knowledge. At HomeAbroad, we offer US mortgage products for foreign nationals & investors and have a network of 500+ expert HomeAbroad real estate agents to provide the expertise you need. Our content is written by licensed mortgage experts and seasoned real estate agents who share insights from their experience, helping thousands like you. Our strict editorial process ensures you receive reliable and accurate information.
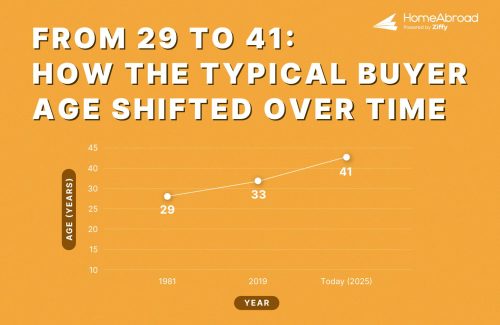
The typical American buying a home today is about 41 years old, twelve years older than in 1981.
Back then, NAR data shows first-time buyers clustered around 29; by 2019 it was 33. Our analysis of 1.47 million home purchase mortgages across the 50 largest U.S. metros finds that milestone has jumped into the early 40s, turning homeownership from a young-adult launchpad into a midlife event.
Table of Contents
Key Findings
-
 Compared with NAR’s medians for first-time buyers (29 in 1981 and 33 in 2019), our HMDA-based average age of 41 across the 50 largest metros represents a 12-year gap vs 1981 and an 8-year gap vs 2019.
 - 48 of 50 major metros (96%) now have average buyer ages of 40 or older, and 16 metros (32%) are at 42+, making 40-something buyers the norm in large markets.
- Las Vegas–Henderson–North Las Vegas and Orlando–Kissimmee–Sanford both have average buyer ages of 44 (about +15 years vs 1981), and four Florida metros (Orlando, Jacksonville, Tampa, Miami) rank among the 10 oldest.
- Even the youngest homebuyer metros (Pittsburgh and Salt Lake City-Murray at 39) represent a 10-year gap versus 1981. The housing crisis has reached every corner of America.
The Generational Shift: Four Decades of Change
When the National Association of Realtors began tracking first-time homebuyer ages in 1981, the median was 29 years old. A young couple could graduate college, work for a few years, save a down payment, and buy their first home before turning 30. Homeownership was a milestone of early adulthood.
By 2019, that NAR median had risen to 33, a 4-year increase that reflected rising home prices, student debt burdens, and changing life patterns. Today, our HMDA-based average across the 50 largest metros stands at 41 years. While these metrics aren’t directly comparable (NAR uses survey medians; our figure is a mortgage-record average), both point to the same conclusion: homebuyers are significantly older than they used to be.
-
 12-year gap vs. 1981: Today’s average buyer age is more than a decade above the 1981 NAR median
 - 8-year gap vs. 2019: Even compared to the pre-pandemic 2019 NAR median, today’s buyers are years older
- 48 of 50 metros over age 40: What was once exceptional is now the norm
This shift has profound implications. A buyer who purchases at 41 instead of 29 has 12 fewer years to build equity, 12 fewer years of appreciation, and often faces competing demands from children’s education and retirement savings. The math of homeownership as America’s primary wealth-building vehicle has fundamentally changed.

Amresh Singh
CEO and FounderHomeAbroad and Ziffy
Who’s Buying Homes? Age Distribution Across 50 Metros
Analysis of 1,475,656 home purchase loans reveals how different age groups are represented in today’s market:
Age Group | % Share |
|---|---|
Under 25 | 5% |
25-34 | 33% |
35-44 | 29% |
45-54 | 17% |
55-64 | 10% |
65-74 | 5% |
75+ | 1% |
What the Data Reveals
1. Las Vegas has the nation’s oldest home purchase borrowers at 44, a 15-year gap above the 1981 NAR baseline.
LAS VEGAS-HENDERSON-NORTH LAS VEGAS tops the list with an average buyer age of 44 years. Compared to the 1981 NAR baseline of 29, today’s Vegas borrowers are 15 years older, and 11 years above the pre-pandemic 2019 median of 33. The metro’s transformation into a Sun Belt retirement and investment destination has pushed buyer ages higher than even California’s most expensive markets.
-
 Average buyer age: 44 years (Rank: #1 oldest)
 - Delay vs. 1981 (age 29): +15 years
- Delay vs. 2019 (age 33): +11 years
- Buyers under 35: 30%
- Buyers 45+: 44%
2. Florida claims 4 of the top 10 oldest-buyer metros, with buyers waiting 10 years longer than pre-pandemic 2019.
The Sunshine State’s pandemic-era housing boom has fundamentally aged its buyer pool. ORLANDO-KISSIMMEE-SANFORD (44), JACKSONVILLE (43), TAMPA (43), MIAMI-MIAMI BEACH-KENDALL (42) all rank among the nation’s oldest buyer markets. Rising insurance costs, now averaging over $4,000 annually in Florida, combined with intense competition from retirees and investors have created conditions that particularly impact younger buyers.
- Orlando: 44 years (+15 vs 1981, +11 vs 2019)
- Jacksonville: 43 years (+14 vs 1981, +10 vs 2019)
- Tampa: 43 years (+14 vs 1981, +10 vs 2019)
- Miami: 42 years (+13 vs 1981, +9 vs 2019)
3. Even the nation’s youngest markets (Pittsburgh and Salt Lake City-Murray at 39) still shows a 10-year gap versus 1981’s typical buyer.
Pittsburgh and Salt Lake City-Murray are tied for the youngest average buyer age at 39 years, yet both are still about a decade older than the 1981 NAR median of 29 for first-time buyers. They also have some of the highest shares of younger buyers, but even these “best case” markets no longer resemble early-1980s norms.
Pittsburgh
- Average buyer age: 39 years (youngest tie)
- Gap vs 1981 (age 29): +10 years
- Buyers under 35: 47%
- Buyers 45+: 28%
Salt Lake City–Murray
- Average buyer age: 39 years (youngest tie)
- Gap vs 1981 (age 29): +10 years
- Buyers under 35: 43%
- Buyers 45+: 29%
4. 48 of 50 metros now have average buyer ages of 40 or higher; a threshold that would have been 11 years above normal in 1981.
In 1981, a 40-year-old first-time buyer would have been 11 years older than the median, a clear outlier. Today, 48 of 50 metros (96%) have crossed this threshold. The only metros still below 40 are: PITTSBURGH (39), SALT LAKE CITY-MURRAY (39).
| Metros with avg age 40+: | 48 of 50 (96%) |
| Metros with avg age 42+: | 16 of 50 (32%) |
| Metros with avg age under 40: | Only 2 |
5. Only 38% of home purchase borrowers are under 35, with Orlando at just 29%, the lowest in the nation.
In 1981, when the median buyer was 29, the majority of first-time buyers were under 35. Today, only 38% of buyers across the 50 metros fall into this age group. The under-35 cohort has been squeezed out of homeownership in most major markets. Midwest metros like GRAND RAPIDS-KENTWOOD and Pittsburgh still see 47% of buyers under 35, while Sun Belt markets like ORLANDO-KISSIMMEE-SANFORD (29%) and Miami (30%) have the fewest young buyers.
| Average % under 35: | 38% |
| Highest: | 1. GRAND RAPIDS-KENTWOOD (47%) 2. Pittsburgh (47%) |
| Lowest: | 1. ORLANDO-KISSIMMEE-SANFORD (29%) 2. Miami (30%) |
6. The South and West have the oldest buyers at 42, while the Midwest (40) remains youngest.
Every region shows significant gaps compared to 1981. The South leads with an average buyer age of 42, driven by Florida’s older buyer pool. The West follows at 42, despite including tech hubs with younger buyers. Even the Midwest, with the youngest regional average at 40, shows a +11 gap versus the 1981 baseline.
Region | Avg Homebuyer Age | Delay (Current – 1981 Age) | |
|---|---|---|---|
South | 42 years | +13 | 20 metros |
West | 42 years | +13 | 13 metros |
Northeast | 40 years | +11 | 6 metros |
Midwest | 40 years | +11 | 11 metros |
7. In New York, the nation’s largest metro, buyers average 41 years old with only 34% under 35.
The New York metro area (home to over 20 million people) reflects the national trend. With an average buyer age of 41, only 34% of home purchase borrowers are under 35, while 32% are 45 or older. The city that once defined young professional ambition now sees homeownership pushed firmly into middle age.
- Average buyer age: 41 years
- Buyers under 35: 34%
- Buyers 45+: 32%
8. California shows a North-South divide: Bay Area buyers average 40-41, while Southern California averages 42-43.
California’s housing story varies by region. In the Bay Area, tech wealth appears to enable younger buyers: San Jose (40) and San Francisco (41) rank among the youngest California metros. But outside the Bay Area, inland and Southern California metros like Riverside (43), Sacramento (43), and Los Angeles (42) all exceed the national average.
- Youngest Buyers CA metros: San Jose (40), Fresno (40), San Francisco (41)
- Oldest Buyers CA metros: Riverside (43), Sacramento (43), San Diego (42)
9. All four Texas metros cluster at 40-41 years, bucking the Sun Belt’s older-buyer trend seen in Florida and Arizona.
Texas tells a different Sun Belt story. While Florida metros rank among the nation’s oldest (Orlando 44, Jacksonville 43, Tampa 43), all four Texas metros remain in the 40-41 range; at or below the national average. Strong job growth and relatively lower barriers to entry may be keeping Texas accessible to younger buyers.
City | Avg Homebuyer Age | % Share of Buyers Under 35 |
|---|---|---|
Austin | 40 years | 38% |
Dallas | 41 years | 36% |
Houston | 41 years | 36% |
San Antonio | 41 years | 39% |
10. In Las Vegas and Orlando, 44% of buyers are 45 or older; nearly half the market is middle-aged or older.
The 45+ cohort now dominates several major markets. In Las Vegas, 44% of home purchase borrowers are 45 or older. Orlando follows at 43%. Phoenix (41%), Jacksonville (41%), and Tampa (40%) round out the top five. In these markets, buyers entering their peak earning years (or already past them) are competing with and often outbidding younger households.
- Las Vegas: 44% of buyers are 45+
- Orlando: 43% of buyers are 45+
- Phoenix: 41% of buyers are 45+
- National average: 33% of buyers are 45+
11. Across the 50 largest metros, buyers under 25 make up only about 5% of home purchase borrowers; roughly 1 in 20.
Analysis of 1,475,656 home purchase loans shows that borrowers under age 25 account for only about 5% of buyers across the 50 largest metros; roughly 1 in every 20 purchase loans. The entry-level, early-20s homeowner that once symbolized the American dream is now largely missing from the data, crowded out by older buyers with higher incomes and more savings.

Debjit Saha
Co-Founder and Real Estate Expert
HomeAbroad and Ziffy
Top 10 Metros with Greatest Delay (Oldest Buyers)
Metro | Avg Age | Vs 1981 Age | Vs 2019 Age | % Buyers under 35 |
|---|---|---|---|---|
1. Las Vegas–Henderson–North Las Vegas, NV | 44 | +15 | +11 | 30% |
2. Orlando–Kissimmee–Sanford, FL | 44 | +15 | +11 | 29% |
3. Jacksonville, FL | 43 | +14 | +10 | 33% |
4. Phoenix–Mesa–Chandler, AZ | 43 | +14 | +10 | 36% |
5. Tampa, FL | 43 | +14 | +10 | 32% |
6. Riverside–San Bernardino–Ontario, CA | 43 | +14 | +10 | 32% |
7. Sacramento–Roseville–Folsom, CA | 43 | +14 | +10 | 31% |
8. Memphis, TN | 42 | +13 | +9 | 34% |
9. Miami–Miami Beach–Kendall, FL | 42 | +13 | +9 | 30% |
10. Atlanta–Sandy Springs–Roswell, GA | 42 | +13 | +9 |
|
Top 10 Metros with Least Delay (Youngest Buyers)
Metro | Avg Age | vs 1981 Age | vs 2019 Age | % Buyers under 35 |
|---|---|---|---|---|
1. Salt Lake City–Murray, UT | 39 | +10 | +6 | 43% |
2. Pittsburgh, PA | 39 | +10 | +6 | 47% |
3. Seattle–Bellevue–Kent, WA | 40 | +11 | +7 | 40% |
4. Philadelphia, PA | 40 | +11 | +7 | 42% |
5. Grand Rapids–Kentwood, MI | 40 | +11 | +7 | 47% |
6. San Jose–Sunnyvale–Santa Clara, CA | 40 | +11 | +7 | 35% |
7. Minneapolis–St. Paul–Bloomington, MN | 40 | +11 | +7 | 43% |
8. Detroit–Dearborn–Livonia, MI | 40 | +11 | +7 | 44% |
9. Cincinnati, OH | 40 | +11 | +7 |
|
10. Austin–Round Rock–Georgetown, TX | 40 | +11 | +7 | 38% |
Methodology
Data Sources
1. Home Mortgage Disclosure Act (HMDA) Data
Source: Consumer Financial Protection Bureau (CFPB) HMDA Data Browser. URL: https://ffiec.cfpb.gov/data-browser/. Year: 2024. Used for: Applicant age distribution and average buyer age by metro.
2. National Association of Realtors (NAR)
Source: NAR Profile of Home Buyers and Sellers (annual survey, 1981-2024). Used for: Historical baseline ages, 29 years in 1981 (first year of survey) and 33 years in 2019 (pre-pandemic). The NAR survey is the authoritative source for first-time homebuyer demographics.
Top 50 Metros Selection
- The analysis focuses on the 50 largest U.S. metropolitan areas by population, based on the most recent U.S. Census Bureau metro population estimates available at the time of the study.
- Each Census-defined metro (e.g., “New York–Newark–Jersey City, NY–NJ Metro Area”) was matched to the closest HMDA reporting geography (MSA/MD name) to obtain loan-level age data.
- In some cases, this required using a core HMDA label rather than the full Census metro name.
- Example: the Census metro “New York–Newark–Jersey City, NY–NJ” is matched to HMDA’s “New York–Jersey City–White Plains, NY–NJ” definition for mortgage records.
- All references to the “50 largest metros” in this report refer to these population-ranked, HMDA-matched metropolitan areas.
Delay Calculations
Delay vs. 1981: Current metro average age minus 29 (1981 NAR baseline). Delay vs. 2019: Current metro average age minus 33 (2019 pre-pandemic NAR baseline). These calculations show how much longer today’s buyers wait compared to historical norms.
HMDA Filters Applied
Action Taken: Loan Originated (closed loans only). Loan Purpose: Home Purchase (excludes refinances). Total Units: 1 (single-family properties). All loan types included (Conventional, FHA, VA, USDA).
Age Calculation
HMDA reports applicant age in brackets rather than exact ages. Weighted average age calculated using midpoint values: <25 (22), 25-34 (30), 35-44 (40), 45-54 (50), 55-64 (60), 65-74 (70), >74 (77). Analysis focuses on primary applicant age only.
First-Time Buyer Proxy
HMDA does not include a direct first-time homebuyer indicator. This analysis uses home purchase loans for single-family (1-unit) properties as a proxy for first-time buyer activity. This proxy may include some repeat buyers; however, single-family home purchase loans closely track first-time buyer behavior in aggregate. NAR’s historical baselines are survey-based medians for self-identified first-time buyers. While our HMDA average and NAR’s survey median are not identical metrics, both consistently capture the aging trend in home purchase activity.
Limitations
Age brackets in HMDA reduce precision vs. exact ages. Historical NAR data is national median; metro-specific historical data not available. Listing prices (Oct 2025) and HMDA data (2023) are from different periods. HMDA proxy may include some repeat buyers. NAR figures are survey-based medians while our analysis produces averages from mortgage records, comparisons should be interpreted as directional rather than precise.


![U.S. Home Construction Permits Declined 32% in Top 100 Metros [2025]](https://homeabroadinc.com/wp-content/uploads/2025/09/USHomeConstruction.jpg)