![Foreign Investment in US Real Estate: 45 Key Statistics [2026]](https://homeabroadinc.com/wp-content/uploads/2022/06/stats-foreign-500x325.png)

Editorial Integrity
Making informed real estate decisions starts with having the right knowledge. At HomeAbroad, we offer US mortgage products for foreign nationals & investors and have a network of 500+ expert HomeAbroad real estate agents to provide the expertise you need. Our content is written by licensed mortgage experts and seasoned real estate agents who share insights from their experience, helping thousands like you. Our strict editorial process ensures you receive reliable and accurate information.
Key Takeaways:
1. Foreign buyers purchased $56 billion worth of US existing homes between April 2024 and March 2025.
2. They bought 78,100 properties, a 44% increase from the previous 12-month period.
3. 47% of international buyers paid all cash, compared with 28% of all US existing homebuyers.
4. 56% of foreign buyers already lived in the US as recent immigrants or visa holders.
5. China, Canada, Mexico, India, and the United Kingdom were the top five countries of origin, together accounting for nearly half of foreign purchase volume.
6. Florida, California, and Texas remained the leading destinations for foreign buyers, followed by New York and Arizona.
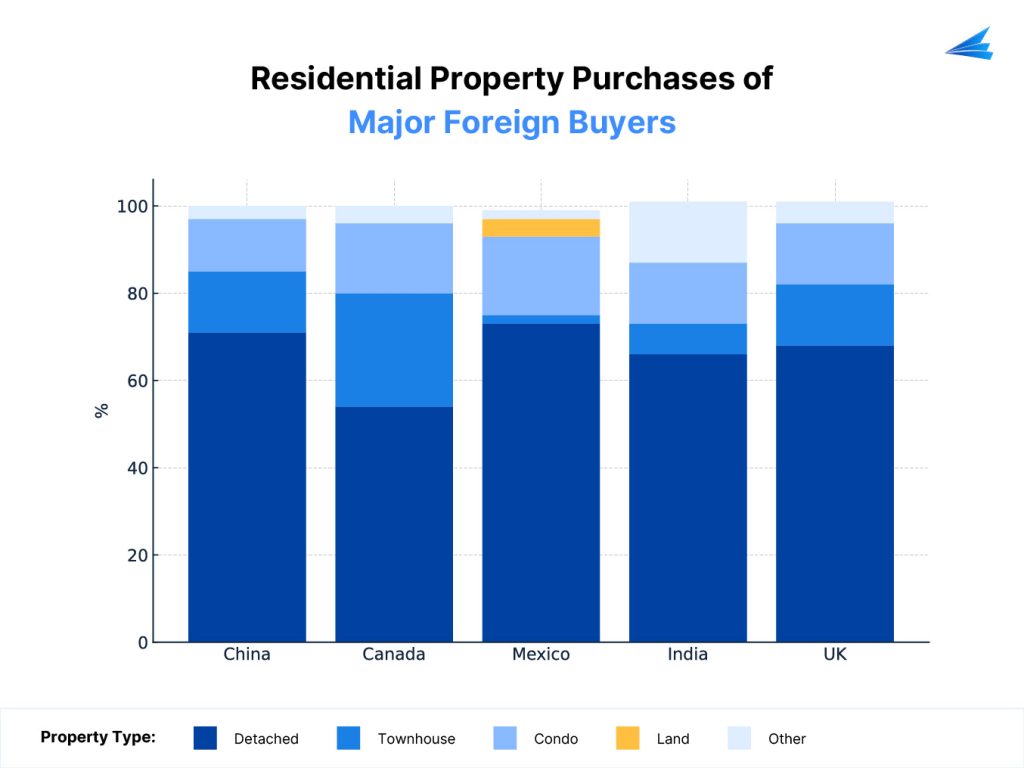
7. Single family homes and townhomes made up 77% of all purchases by foreign nationals.
Table of Contents
Foreign nationals have always viewed the United States as a reliable place to buy real estate. Some choose it for lifestyle reasons. Others want long-term stability or a place to build wealth through rentals or vacation homes. Even with global economic uncertainty, interest from international real estate investors has picked up again.
The latest data from the National Association of Realtors (NAR) shows that foreign demand picked up again after several years of decline. At the same time, international buyers are still purchasing far fewer homes than before the pandemic, which creates interesting opportunities for well-prepared foreign investors.
Let us look at who is buying, where they are buying, and how foreign demand has shifted over the last five years.
5-Year Snapshot: Foreign Investment in US Real Estate (2021 to 2025)
Survey Year | Period Covered | Dollar Volume (USD) | Homes Purchased |
|---|---|---|---|
2021 | Apr 2020 to Mar 2021 | $54.4 billion | 107,000 |
2022 | Apr 2021 to Mar 2022 | $59.0 billion | 98,600 |
2023 | Apr 2022 to Mar 2023 | $53.3 billion | 84,600 |
2024 | Apr 2023 to Mar 2024 | $42.0 billion | 54,300 |
2025 | Apr 2024 to Mar 2025 | $56.0 billion | 78,100 |
Highlights: Foreign Investment US Real Estate Statistics 2026
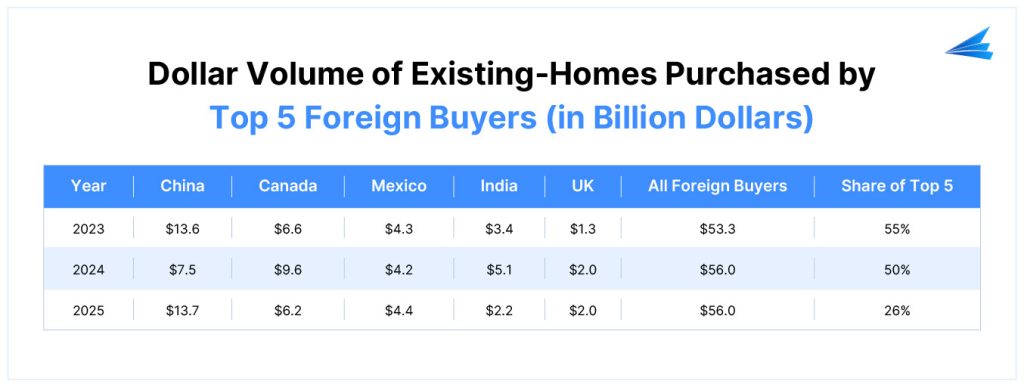
1. From April 2024 to March 2025, foreign buyers purchased 78,100 US existing homes worth $56 billion.
2. This represents a 33.2% increase in dollar volume and a 44% increase in transaction count compared with the previous year.
3. The median purchase price for foreign buyers reached a record $494,400, higher than the median for all existing US homes.
4. 47% of foreign buyers paid all cash, versus 28% among all US existing homebuyers.
5. 56% of foreign buyers were resident foreigners (recent immigrants or visa holders) already living in the US, and 44% were non-resident foreigners purchasing from abroad.
6. Overall, foreign buyers still represent a small share of total US transactions, but they are highly concentrated in a few states and higher price segments.
7. China, Canada, Mexico, India, and the United Kingdom together account for almost half of all foreign buyer spending.
8. The average purchase price for foreign buyers in 2025 was about $719,000, showing how much of this activity occurs in higher-priced markets.
Which Countries Invest Most in US Real Estate?
9. Between April 2024 and March 2025, buyers from China, Canada, Mexico, India, and the United Kingdom accounted for 47% of the $56 billion spent by foreign nationals on US residential real estate.
10. Chinese buyers were the largest group by dollar volume, spending about $13.7 billion and purchasing around 11,700 existing homes.
11. Canadian buyers remained very active, purchasing about 10,900 homes with a total volume of $6.2 billion.
12. Buyers from Mexico bought approximately 6,200 homes, investing $4.4 billion across multiple states.
13. Indian nationals purchased about 4,700 properties, contributing $2.2 billion in volume.
14. Buyers from the United Kingdom acquired about 3,100 homes and spent $2 billion, continuing a long-term pattern of interest in US real estate.
15. Together, these top five countries shape pricing and demand in several key states, especially Florida, California, Texas, New York, and Arizona.
Foreign Real Estate Buyers Financing Statistics [2026]
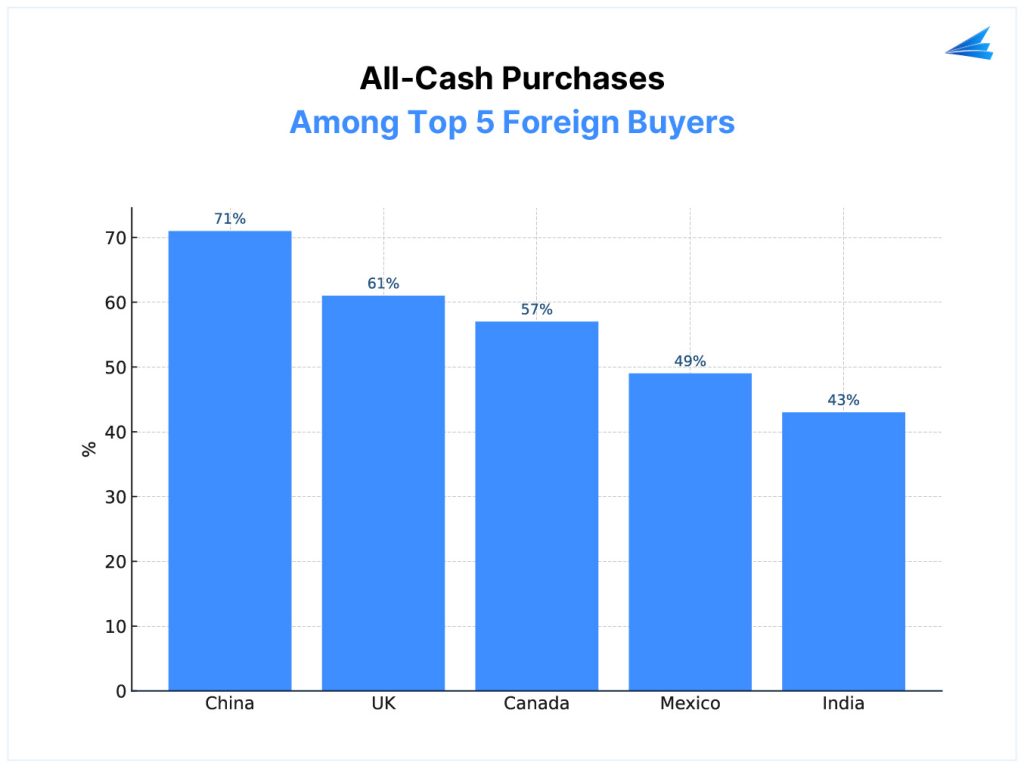
16. 47% of foreign buyers in 2025 paid all cash for their US residential purchases, compared with 28% of all US existing homebuyers.
17. Non-resident foreign buyers were more likely to pay all cash. About 56% of foreign buyers living abroad closed without financing, compared with 39% of foreign buyers already living in the US.
18. Chinese buyers had the highest share of all-cash purchases at about 71%, reflecting both capital controls and a preference for fast, non-contingent deals.
19. UK buyers followed with about 61% all-cash purchases, while Canadian buyers had a 57% cash share.
20. Mexican buyers paid cash in 49% of transactions, and Indian buyers had the lowest share of all-cash deals at 43%, since many Indian buyers already live in the US and qualify for mortgage financing.
For investors, this high cash share means foreign buyers often compete more on speed and certainty than on financing terms.
Why are Foreigners Buying Property in the US?
21. In 2025, 47% of foreign buyers purchased property as a vacation home, rental, or both, slightly higher than the year before.
22. Among non-resident foreign buyers, this share rose to 60%, showing strong demand for US vacation properties and rental income from abroad.
23. Canadian buyers were especially likely to buy for vacation use, with about 49% purchasing second homes.
24. UK buyers also leaned toward vacation use, at about 27%.
25. Indian, Mexican, and Chinese buyers were more likely to focus on primary residences, with shares of around 66% for Indian buyers, 53% for Mexican buyers, and 45% for Chinese buyers.
26. Homes for student use were most common among buyers from the UK (about 18%) and China (about 16%), often in university cities.
For many foreign nationals, a single property meets several goals at once: a secure base in the US, rental income during part of the year, and long-term capital appreciation.
Where are Foreigners Buying Homes in the US? [2026]
27. Florida remains the clear leader, capturing 21% of all foreign buyer purchases. Foreign demand in Florida is split mainly between Canadian buyers and buyers from Latin America, each accounting for about 31% of foreign purchases in the state.
28. California ranked second with 15% of foreign purchases, driven heavily by buyers from Asia, especially China. More than half of California’s foreign buyers came from Asia.
29. Texas accounted for 10% of foreign purchases, with strong demand from buyers in Mexico and India.
30. New York attracted 7% of foreign buyers, primarily from Asia and Latin America.
31. Arizona held 5% of foreign purchases, with foreign demand roughly evenly split among Canadian, Asian, and Latin American buyers.
32. Other important destinations included Hawaii, North Carolina, Michigan, New Jersey, and Illinois, each with around 3% of total foreign buyer activity.
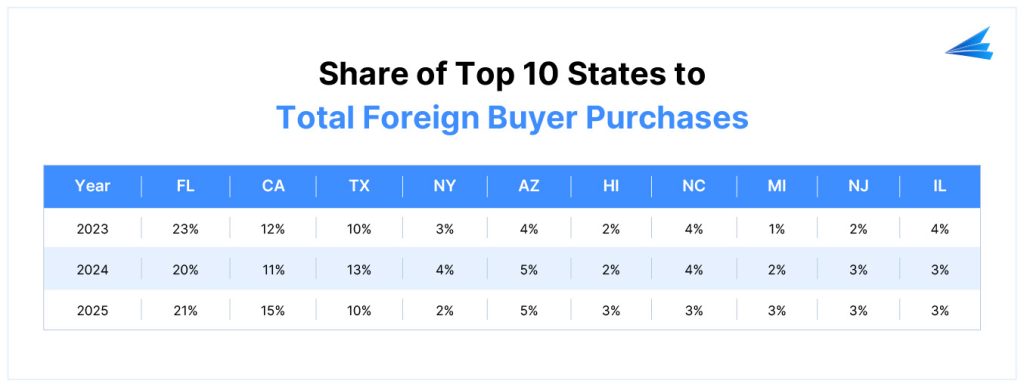
For foreign investors, these states often combine strong rental demand, lifestyle appeal, and liquid resale markets.
Type of Residential Property Purchased By International Buyers [2026]
33. 63% of foreign buyers purchased detached single-family homes, making this the most popular property type.
34. About 18% of foreign buyers living abroad chose condominiums, a higher share than foreign buyers already in the US, who more often bought single-family homes.
35. Townhouses and condos were especially popular among Canadian buyers, who often use them as vacation or rental properties in resort or coastal markets.
36. Mexican buyers had the highest share of residential land purchases among the top foreign buyer groups, often tied to future construction or long-term land banking strategies.
Types of Areas Where Foreigners Buy Property [2026]
37. Suburban areas were the top choice, attracting 44% of foreign buyer purchases.
38. About 40% of foreign buyers purchased in central city or urban areas, a higher share than among domestic US buyers.
39. Nearly 60% of Asian Indian buyers preferred suburban locations, which aligns with their focus on primary residences close to jobs, schools, and family life.
40. Canadian buyers leaned toward resort areas, with nearly half buying vacation homes in leisure and retirement destinations.
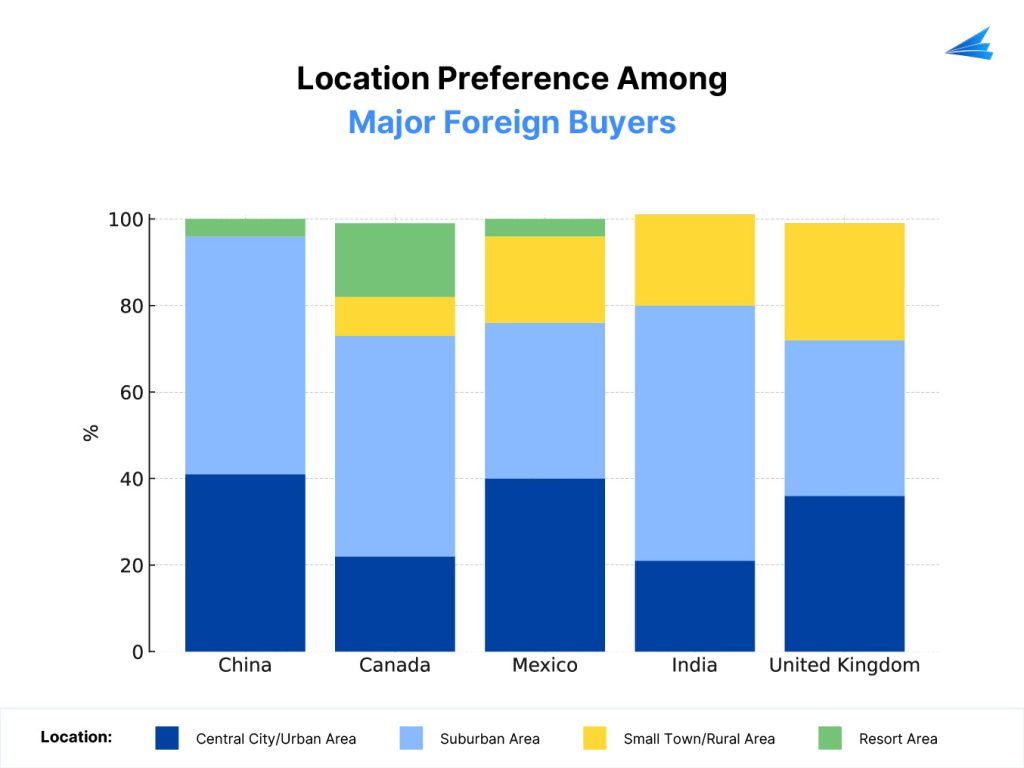
For international real estate investors, this pattern highlights strong international demand in both suburban job corridors and lifestyle-driven resort markets.
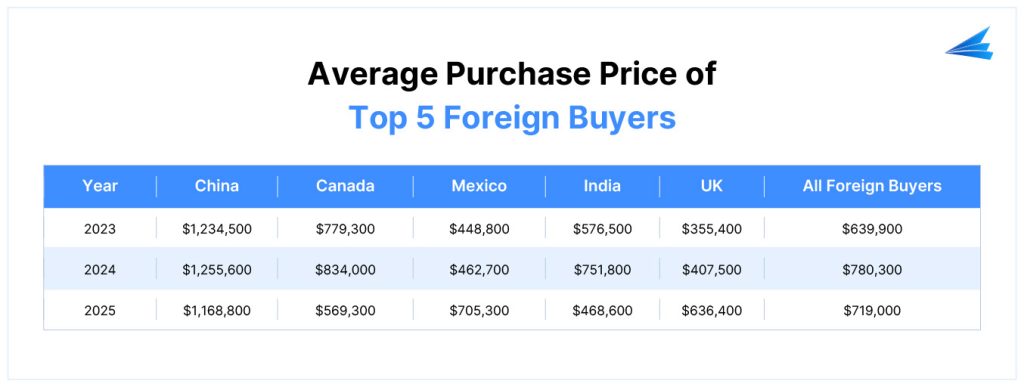
Most Expensive Property Purchased by Foreign Buyers in the US [2026]
41. Chinese buyers had the highest average purchase price at about $1.17 million in 2025. About 36% of their purchases were in California, and 9% were in New York, both high-cost markets.
42. Mexican buyers recorded the second-highest average purchase price among major groups at about $705,300. Notably, 16% of Mexican buyers purchased homes over $1 million, up from 8% the prior year.
43. Canadian buyers also purchased at elevated price points, with an average of about $569,300, often in resort or coastal areas.
44. Indian buyers had an average purchase price of about $468,600, while buyers from the United Kingdom averaged about $636,400.
45. Overall, the median purchase price among all foreign buyers reached $494,400 in 2025, reflecting the concentration of international activity in higher-priced segments of the market.
Why choose HomeAbroad for US Real Estate Investment as a Foreign National?
-
 AI-driven investment property search platform
 - Investor-friendly mortgages for foreign nationals
- No US credit history required
- LLC and US bank account setup
- Expert guidance from start to end
- Remote closing option
- Local agents with global investor expertise
Conclusion
Foreign investment in US real estate is growing again after several quieter years. The 2025 rebound shows that international buyers still see the US as a secure place to live, study, and invest.
For many foreign nationals, US property serves multiple roles at once:
- A primary home in a stable country
- A source of rental income in strong job and tourism markets
- A long-term asset in a market with strong property rights and transparent lending rules
At the same time, total foreign demand is still below pre-pandemic levels. That gives well-prepared buyers room to negotiate, especially in markets where domestic demand has cooled.
If you are planning to buy a home in the US as a foreign national, the right strategy combines:
- Careful market and neighborhood selection
- Clear understanding of tax, lending, and ownership rules for non-US residents
- Local experts from HomeAbroad who understand both US real estate and your situation as an international investor and buyer