





Editorial Integrity
Making informed real estate decisions starts with having the right knowledge. At HomeAbroad, we offer US mortgage products for foreign nationals & investors and have a network of 500+ expert HomeAbroad real estate agents to provide the expertise you need. Our content is written by licensed mortgage experts and seasoned real estate agents who share insights from their experience, helping thousands like you. Our strict editorial process ensures you receive reliable and accurate information.
Toledo, Jackson and El Paso lead the under-$300K ranking, with gross rental yields of 7.39%, 8.43% and 7.82% as of August 2026.
29 of the 97 largest US metros with available data have a typical home value at or below $300,000.
All 10 top-ranked metros have a gross yield above the national figure of 6.34%, and both rents and home values rose in each over the past year.
A high yield is not enough to rank well. Lakeland, Florida has the fourth-highest gross yield in the group at 7.46% but ranks 23rd, because home values there fell 2.4% in a year.
HomeAbroad’s DSCR Loan qualifies eligible foreign nationals primarily on the property’s rental income, with no established US credit history required.
Table of Contents
The best rental markets for cash flow under $300K are Toledo, Ohio; Jackson, Mississippi; and El Paso, Texas, based on August 2026 home value and rent data. Their gross rental yields are 7.39%, 8.43% and 7.82%, and the typical home in each costs less than $235,000.
Yield alone did not decide the order. Jackson has the highest gross yield of any large US metro, but Toledo ranks first because its rents rose 5.7% over the past year, the fastest pace among the qualifying markets, at a lower typical price. The ranking weighs yield together with rent growth, home value growth and price.
For a financed purchase, a market only helps if the rent is likely to cover the mortgage payment by enough to support a loan. That test is the Debt Service Coverage Ratio (DSCR), the ratio of rent to the monthly housing payment, and it is the basis of HomeAbroad’s DSCR Loan.
The Best Cash Flow Rental Markets Under $300K at a Glance
These are the 10 highest-scoring metros among the 29 that passed the price band.
Metro | Typical home value | Typical monthly rent | Gross rental yield | Rent growth, 5 years | Home value growth, 5 years |
|---|---|---|---|---|---|
Toledo, OH | $205,237 | $1,264 | 7.39% | 30.5% | 26.8% |
Jackson, MS | $214,315 | $1,506 | 8.43% | 26.1% | 19.6% |
El Paso, TX | $234,069 | $1,525 | 7.82% | 30.3% | 32.6% |
Syracuse, NY | $270,832 | $1,607 | 7.12% | 34.5% | 47.2% |
Cleveland, OH | $253,678 | $1,454 | 6.88% | 32.6% | 31.6% |
Akron, OH | $242,459 | $1,327 | 6.57% | 35.0% | 30.1% |
Pittsburgh, PA | $232,122 | $1,469 | 7.59% | 24.0% | 11.4% |
Columbia, SC | $256,132 | $1,559 | 7.30% | 28.9% | 27.7% |
Wichita, KS | $224,280 | $1,205 | 6.45% | 27.8% | 30.9% |
Augusta, GA | $252,842 | $1,488 | 7.06% | 25.1% | 24.7% |
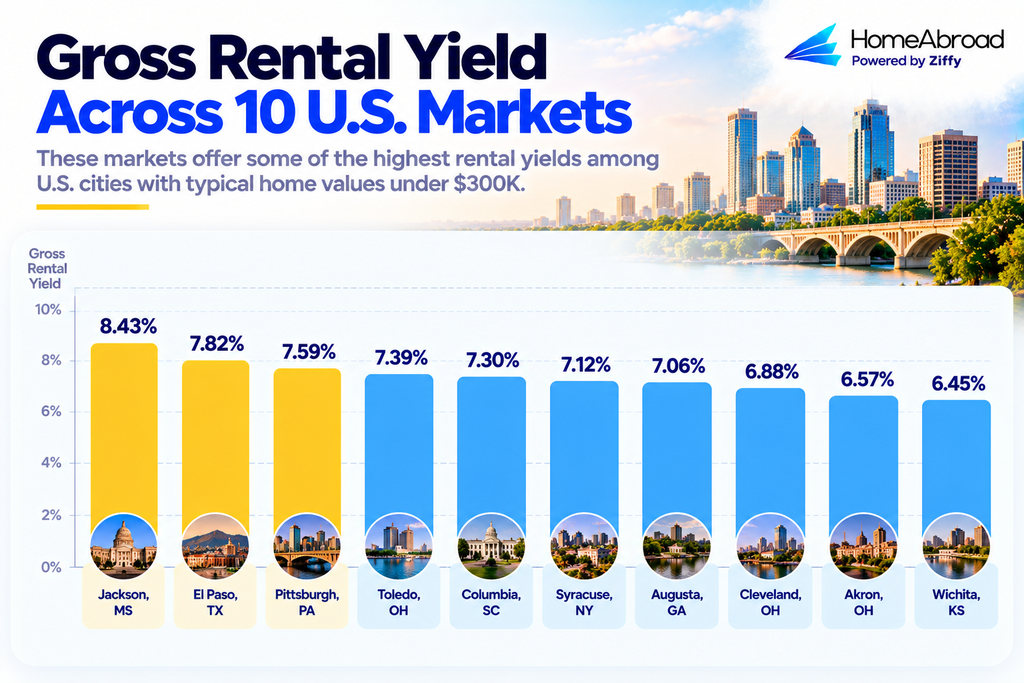
Gross rental yield is annual rent divided by typical home value, before financing and operating costs.
Other Metros That Qualified
Nineteen more metros have a typical home value at or below $300,000. They scored lower, mostly because growth was weaker or the yield was closer to the national figure.
Metro | Typical home value | Typical monthly rent | Gross rental yield |
|---|---|---|---|
Detroit, MI | $267,167 | $1,524 | 6.84% |
Tulsa, OK | $253,643 | $1,382 | 6.54% |
Winston-Salem, NC | $280,379 | $1,541 | 6.59% |
Rochester, NY | $286,834 | $1,536 | 6.42% |
St. Louis, MO | $275,704 | $1,443 | 6.28% |
New Orleans, LA | $261,002 | $1,598 | 7.35% |
Little Rock, AR | $231,747 | $1,265 | 6.55% |
Baton Rouge, LA | $248,895 | $1,382 | 6.67% |
Oklahoma City, OK | $245,317 | $1,388 | 6.79% |
Buffalo, NY | $291,683 | $1,449 | 5.96% |
Greensboro, NC | $263,188 | $1,399 | 6.38% |
McAllen, TX | $193,007 | $1,122 | 6.97% |
Lakeland, FL | $295,821 | $1,840 | 7.46% |
Indianapolis, IN | $293,506 | $1,552 | 6.34% |
Birmingham, AL | $262,563 | $1,433 | 6.55% |
Memphis, TN | $244,737 | $1,400 | 6.86% |
Louisville, KY | $280,129 | $1,348 | 5.77% |
Des Moines, IA | $294,192 | $1,297 | 5.29% |
San Antonio, TX | $276,747 | $1,422 | 6.16% |
Three of these show why the ranking looks past yield. New Orleans yields 7.35%, yet its typical home value is 6.4% lower than five years ago. Lakeland’s values are falling now. San Antonio is the only qualifying metro where both rents and home values declined over the past year.
How We Ranked These Markets
Each metro is scored on six measures of yield, growth and price, all taken from two public data series. The weights are published below so you can see what drives each rank.
Data Sources and Dates
Home values come from the Zillow Home Value Index (ZHVI) and rents from the Zillow Observed Rent Index (ZORI), both published by Zillow Research. All figures are for August 2026. One-year growth compares August 2026 with August 2025, and five-year growth compares it with August 2021.
The home value series covers mid-priced single-family homes and condos. The rent series covers all rental home types, including apartments. Both describe metropolitan areas, which include a central city and its surrounding suburbs.
We started with the 100 largest US metros by population rank, 97 of which have home value data. Smaller markets can show high yields, but they tend to have fewer property managers and fewer comparable rentals, which matters when you own from another country.
What “Under $300K” Means in This Ranking
A metro qualifies when its typical home value is at or below $300,000. Of the 97 metros, 29 qualify. That value is a middle-of-the-market figure for the whole metro. Individual homes in a qualifying metro can cost more, and some homes in metros that missed the cut cost less.
Treat the band as a guide to where a $300,000 budget gives you a wide choice of ordinary rental homes.
Gross Yield Versus Cash Flow
Gross rental yield is annual rent divided by the home’s value:
Gross Rental Yield = (Typical Monthly Rent x 12) / Typical Home Value
It is a quick way to compare markets because it needs only two inputs. It leaves out the mortgage payment, property taxes, insurance, management fees, vacancy and repairs.
Cash flow is what remains after all of those are paid. Two metros with the same gross yield can produce very different cash flow if one has higher property taxes or insurance premiums.
Gross Yield and Net Cash Flow

Gross yield compares rent with price. Net cash flow is rent minus every cost of owning and financing the property. Use gross yield to shortlist markets and net cash flow to judge a specific property.
What This Ranking Cannot Tell You
Metro-level data hides large differences between neighborhoods. A metro with a strong average yield will contain streets where rents are weak or vacancies are long, and others that outperform.
The rent figure blends houses and apartments, so the rent on a single-family home may be higher or lower than the typical figure shown.
The figures describe one point in time. They say nothing about a specific property’s condition, and they do not predict future rents or values. The tables are dated and will be refreshed each quarter.
What a $300K Budget Covers With a HomeAbroad DSCR Loan
A price band tells you what a home costs. If you are financing, the more useful figure is the cash you need to bring and whether the rent supports the loan.
Down Payment, Reserves and Closing Costs
A financed purchase requires cash for the down payment, reserves and closing costs. The down payment covers the portion of the purchase price you pay upfront. Reserves are funds you may need to maintain after closing, typically measured in months of housing payments. Closing costs cover expenses associated with completing the purchase, such as title, appraisal and loan-related fees.
For example, on a $200,000 purchase:
Item | Basis | Amount |
|---|---|---|
Purchase price | Example | $200,000 |
Down payment | 25% of purchase price | $50,000 |
Loan amount | 75% LTV | $150,000 |
Reserves | Six months of mortgage payments | Approximately $10,000 |
Closing costs | Mortgage and purchase-related costs | Approximately $5,000 |
Total cash needed | Down payment + reserves + closing costs | Approximately $65,000 |
Actual reserves depend on the property’s monthly housing payment and the applicable loan program.
Closing costs can include appraisal, title services, loan-related fees, recording charges and prepaid expenses. They vary by property location and transaction, so the $5,000 figure should be treated as a budgeting estimate rather than the actual cost.
At the top of the $300,000 price range, the same 25% down payment would require $75,000 upfront, before reserves and closing costs.
How the DSCR Is Calculated
A DSCR Loan looks first at whether the property’s rent covers its monthly housing payment. That payment is called PITIA: principal, interest, property taxes, insurance and any homeowners association dues.
DSCR = Gross Monthly Rent / Monthly PITIA
A property renting for $1,800 a month with a PITIA of $1,500 has a DSCR of 1.20. The rent covers the payment with 20% to spare. A ratio of 1.00 means rent and payment are equal.
The rent used in underwriting comes from a lease or from the appraiser’s market rent estimate, so it can differ from the rent a listing advertises. You can test a property with the DSCR Loan calculator before you make an offer. The result is an estimate.
Why a High Yield Does Not Always Mean a Passing DSCR
A high gross rental yield does not guarantee a strong DSCR. Gross yield compares rent with the property’s purchase price, while DSCR compares the rent used for underwriting with the property’s monthly PITIA, including principal, interest, property taxes, insurance and applicable homeowners association dues.
This difference matters because two properties with similar rents and purchase prices can produce different DSCR results. Higher property taxes, insurance premiums or HOA dues increase the monthly housing payment and can reduce the property’s DSCR, even when its gross rental yield looks attractive.
Not every property will generate enough rental income to meet a 1.0 DSCR. For eligible properties with a DSCR between 0 and 1, HomeAbroad offers a No-Ratio DSCR Program that can still provide financing, although it generally comes with a 5% reduction in maximum LTV and a higher interest rate. This option can work for investors pursuing properties with strong long-term potential despite lower initial cash flow.

Jeff Larrabee
Senior Customer Loan Specialist, HomeAbroad
When a foreign investor brings a high-yield property with a thin DSCR, we first look at the property’s rent, PITIA and how the ratio was calculated. If the standard DSCR requirement is not met, we can evaluate whether the No-Ratio DSCR Program is a suitable option.
Metro Profiles: Where the Numbers Hold Up
The ten profiles below explain what put each metro in the ranking and where its numbers are weakest.
1. Toledo, Ohio
Typical home value: $205,237. Typical rent: $1,264. Gross yield: 7.39%.
Toledo ranks first because none of its numbers is weak. The typical home costs a little over half the national figure of $368,697, and only one other qualifying metro is cheaper.
Rents rose 5.7% over the past year, the fastest pace among all 29 qualifying metros and more than twice the national rate of 2.5%. That is an acceleration from 2.4% the year before, and it added about $68 to the typical monthly rent. Home values rose 3.3% and reached their highest level on record in August.
Over five years, rents have grown faster than prices (30.5% against 26.8%), so the gross yield has edged up from 7.18% to 7.39%.
The limit is the size of the rent. At $1,264 a month, a single repair bill or an empty month takes a larger share of annual income than it would in a higher-rent market. Toledo suits an investor with a smaller cash budget who wants yield and current momentum together. The wider Ohio housing market places three metros in this top 10.
2. Jackson, Mississippi
Typical home value: $214,315. Typical rent: $1,506. Gross yield: 8.43%.
Jackson has the highest gross yield of any large US metro. A typical rent of $1,506 on a typical value of $214,315 produces 8.43%, more than two points above the national 6.34%.
Rents are still climbing, up 3.8% over the year, and the yield has widened from 7.99% five years ago. Home values rose 2.9% in the same period.
Price growth is the weaker side. Values are up 19.6% over five years, slightly behind the national 20.3%, and they have been flat since May. Jackson is an income market first, and an investor counting on appreciation should weigh that record.
It is also the smallest metro in the top 10 by population rank, so confirm that you can find a property manager who takes single rentals before you commit to it.
3. El Paso, Texas
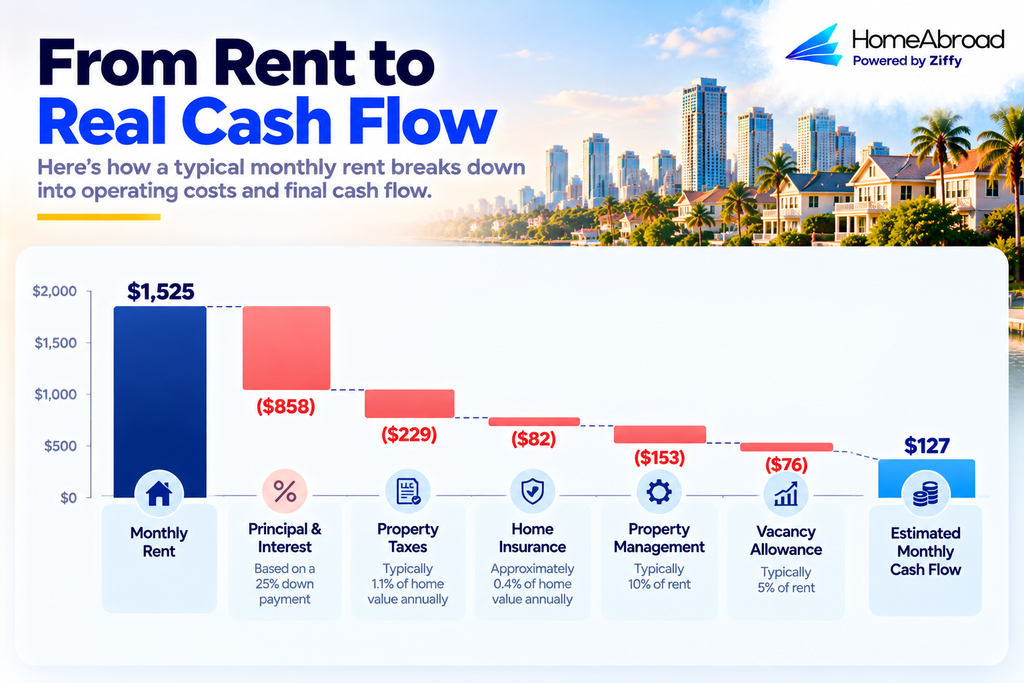
Typical home value: $234,069. Typical rent: $1,525. Gross yield: 7.82%.
El Paso pairs the second-highest yield in the ranking with one of its better price records. Home values have risen 32.6% in five years, ahead of rents at 30.3%, which is unusual for a market yielding close to 8%.
Because prices grew slightly faster than rents, the yield is a little lower than the 7.96% of five years ago. Recent movement is positive on both sides: rents are up 3.2% over the year, and home value growth has picked up from 0.8% to 2.2%. Both sit at record highs.
El Paso stands apart from the other Texas metros that qualified. San Antonio saw rents fall 1.3% and values fall 1.9% over the year, and McAllen was close to flat on both.
Texas restricts property purchases by certain foreign buyers under Senate Bill 17. Check whether it applies to you before shortlisting any Texas investment property.
4. Syracuse, New York
Typical home value: $270,832. Typical rent: $1,607. Gross yield: 7.12%.
Syracuse is the appreciation leader. Home values rose 6.7% over the past year, the largest gain among all 97 large metros measured, and 47.2% over five years, also the largest.
Rents have grown 34.5% in five years and 3.5% in the last one. That is strong, but prices have run faster, so the gross yield has narrowed from 7.79% to 7.12%. If that continues, a buyer next year will get less rent per dollar invested than a buyer today.
Two other points deserve attention. The typical rent has slipped 0.6% from its May peak, the only recent dip in the top 10. And at $270,832, Syracuse is the most expensive metro in the top 10, needing about a third more cash than Toledo at the same down payment percentage.
It fits an investor who wants a yield above 7% and puts real weight on price growth.
5. Cleveland, Ohio
Typical home value: $253,678. Typical rent: $1,454. Gross yield: 6.88%.
Cleveland’s case rests on consistency. Rents rose 4.5% and home values 3.9% over the past year, after 4.3% and 4.5% the year before.
Over five years, rents and values have moved almost in step, at 32.6% and 31.6%. The gross yield has therefore barely changed, from 6.83% to 6.88%. An investor buying here is getting roughly the same rent-to-price relationship that has held for five years.
The yield itself is mid-table, 11th of the 29 qualifying metros. Cleveland ranks fifth on the strength of its growth figures, so it suits a buyer who will accept a lower starting yield for a steadier record. It is also the second-largest metro in the top 10, which generally means more listings and more rental comparables to work from.
6. Akron, Ohio
Typical home value: $242,459. Typical rent: $1,327. Gross yield: 6.57%.
Akron has the strongest five-year rent growth of any qualifying metro at 35.0%, and the second-fastest one-year growth at 4.9%. Home values rose 4.2% over the year.
Its starting yield is the second-lowest in the top 10. It has been improving, from 6.33% five years ago to 6.57%, because rents have outpaced prices.
Compared with Cleveland, the typical Akron home costs about $11,200 less and rents for about $127 less a month. The yields are close, so the choice between the two comes down to budget and to which market has the property and management you can rely on.
Akron is a bet on the rent trend continuing. The current yield alone would not place it in the top 10.
7. Pittsburgh, Pennsylvania
Typical home value: $232,122. Typical rent: $1,469. Gross yield: 7.59%.
Pittsburgh is the largest metro in the top 10 and has the third-highest gross yield among all 97 large metros, at 7.59%.
The yield is high because prices have hardly moved. Home values rose 0.2% over the past year and 11.4% over five years, against 20.3% nationally. Rents grew 24.0% in the same five years, which lifted the yield from 6.83%.
Rent growth of 3.4% over the past year is healthy and above the national rate. Pittsburgh therefore works for an investor who wants income from a large, liquid market and expects most of the return to come from rent. It ranks seventh, despite its yield, because its price record is the weakest in the top 10.
8. Columbia, South Carolina
Typical home value: $256,132. Typical rent: $1,559. Gross yield: 7.30%.
Columbia earns its place through a 7.30% yield and a solid five-year record, with rents up 28.9% and home values up 27.7%.
Recent momentum is softer. Rent growth slowed to 2.1% over the past year from 3.9% the year before, and now sits below the national 2.5%. Home values rose 1.7% and have been flat since May.
Nothing in the data points to decline, but the market is growing more slowly than the metros ranked above it. A buyer here should underwrite on today’s rent and avoid assuming the earlier pace returns.
9. Wichita, Kansas
Typical home value: $224,280. Typical rent: $1,205. Gross yield: 6.45%.
Wichita has the lowest yield in the top 10, only slightly above the national 6.34%, and the lowest typical rent at $1,205.
It ranks on direction and price. Rents rose 4.2% over the year. Home value growth moved from 0.1% to 3.2%, and the typical home value of $224,280 is the fourth-lowest of the 29 qualifying metros. Over five years, values are up 30.9% and rents 27.8%.
The margin for error is thinner here than elsewhere in the top 10. With a modest yield and a low rent, property taxes and insurance will decide whether a specific home produces cash flow, so test real listings carefully before choosing Wichita over a higher-yield market.
10. Augusta, Georgia
Typical home value: $252,842. Typical rent: $1,488. Gross yield: 7.06%.
Augusta’s signals are mixed, which is why it sits at the edge of the top 10 despite a yield above 7%.
Annual rent growth roughly halved, from 5.2% to 2.6%. The most recent months look better, with the typical rent up 2.0% since May. Home values went the other way over the year, rising 2.8% after almost no change the year before.
The five-year figures are close to the group’s middle, at 25.1% for rents and 24.7% for values. Augusta is a reasonable income market at a mid-range price. Watch the next few months of rent data to see whether the recent pickup holds.
The rent a property is advertised for is not necessarily the rent used for underwriting. If the appraiser’s market rent comes in lower, the DSCR can change, so investors should base their analysis on a realistic rent estimate rather than the listing alone.

Costs That Reduce Cash Flow for Remote Owners
Gross yield is the starting figure. These are the costs that sit between it and the money that reaches your account.
Property Taxes and Insurance
US property tax is set locally and charged every year as a percentage of the home’s assessed value. Rates differ widely between counties, and a low purchase price does not mean a low tax bill. Homeowners insurance also varies by location, with higher premiums in areas exposed to storms, hail or flooding.
On a financed purchase, both are usually collected with the mortgage payment through an escrow account. The loan servicer holds the money and pays the tax and insurance bills when they fall due. Both count toward PITIA, so they lower the DSCR as well as the cash flow.
Property Management and Vacancy
An owner living abroad needs a local property manager to find tenants, collect rent and handle repairs. Managers usually charge a percentage of collected rent, and many charge a separate fee when they place a new tenant. Ask for the full fee schedule in writing before you buy.
Allow for vacancy too. A home that sits empty for one month a year has lost about 8% of its annual rent. Use the cash flow calculator to see how management fees and vacancy change the result on a specific property.
Older Housing Stock and Repairs
Many lower-priced metros have older homes. Age affects repair costs through roofs, plumbing, wiring, and heating and cooling systems, which are expensive to replace and hard to assess from another country.
A home inspection before closing is the main protection. An inspector examines the property and reports defects, and the report can support a price reduction or a decision to walk away. Budget an annual amount for repairs even when the inspection is clean.
Currency Transfers and US Banking
Your down payment, reserves and closing costs must reach the US in dollars, and rent will arrive in dollars. Exchange-rate movement between the day you agree a price and the day you close can change your cost in your home currency.
Plan the transfer early. Banks in some countries need extra time or paperwork for large outbound transfers, and funds used for a purchase generally need to be documented. A US bank account simplifies rent collection and mortgage payments.
US Tax on Rental Income for Nonresident Owners
Rental income from US property is taxable in the US. For a nonresident alien, the default treatment is a 30% tax on gross rent, or a lower treaty rate, with no deductions. An owner can instead make an election under Section 871(d) of the Internal Revenue Code to treat the income as effectively connected with a US trade or business. With that election, expenses can be deducted and the net income is taxed at graduated rates. The IRS explains both treatments.
When a foreign owner sells, the buyer generally withholds part of the sale price under FIRPTA, the Foreign Investment in Real Property Tax Act. The rate is 15% in most sales. It falls to 10% or 0% in limited cases where the buyer will live in the home and the price is under set thresholds. The withholding is a prepayment toward the tax due, and the FIRPTA withholding rules explain how each tier applies.
Financing a Rental Under $300K With HomeAbroad
Finding the right market is only the first step. HomeAbroad helps foreign investors move from market research to financing and property selection through one platform.
With HomeAbroad, foreign investors can access:
- DSCR Loans: Financing based primarily on the rental income of the investment property.
- No US Credit History Required: Eligible foreign nationals can finance US investment property without an established US credit history.
- AI-Native Investment Property Search: Find properties with estimated rental income, cash flow and financing potential in one place.
- Foreign Investor Support: Get assistance with the property search, financing process and other steps involved in buying US investment property from abroad.
- Concierge Services: Access support with services such as LLC setup, US bank account setup and property management.
Ready to evaluate a rental under $300K? Explore available investment properties with HomeAbroad and see which opportunities may fit your investment and financing strategy.
Frequently Asked Questions
What Is the Best Rental Market Under $300K for Cash Flow?
Toledo, Ohio ranks first in this analysis, followed by Jackson, Mississippi, and El Paso, Texas. The ranking considers gross rental yield, recent and long-term rent growth, home value growth and typical home value. Toledo ranks first because it combines a 7.39% gross rental yield with 5.7% one-year rent growth and a typical home value of $205,237.
Can Foreign Nationals Buy Investment Property in These Markets?
Foreign nationals can generally buy US investment property, although state-specific ownership rules may apply to buyers from certain countries or to certain property types. Before making an offer, confirm that the state and property meet the applicable requirements.
Can a Foreign National Finance a Rental Property Without US Credit History?
Yes. HomeAbroad offers DSCR Loan options for eligible foreign nationals without an established US credit history. Qualification is based primarily on the property’s rental income.
How Should I Choose Between the Top-Ranked Rental Markets?
Start with the market that fits your investment priorities, then evaluate individual properties within it. Compare the property’s purchase price, realistic rental income, taxes, insurance, management costs and potential DSCR. A market with a high average yield does not automatically make every property a strong investment.
How Can I Find Rental Properties Under $300K?
HomeAbroad’s AI-native investment property search platform helps foreign investors identify US properties with estimated rental income, cash flow and financing potential. You can use the platform to move from the metro-level data in this article to specific properties that fit your investment strategy.