





Editorial Integrity
Making informed real estate decisions starts with having the right knowledge. At HomeAbroad, we offer US mortgage products for foreign nationals & investors and have a network of 500+ expert HomeAbroad real estate agents to provide the expertise you need. Our content is written by licensed mortgage experts and seasoned real estate agents who share insights from their experience, helping thousands like you. Our strict editorial process ensures you receive reliable and accurate information.
California’s typical home value is $775,549, down 0.4% year over year and 2.5% below the January 2025 peak, but still up 16.8% over five years.
San Francisco and San Jose recorded the fastest rent growth of any of the 50 largest US metros, at 8.2% and 6.2%, while Austin, San Antonio, Denver and Tampa all posted negative rent growth.
Gross rental yields divide California into four regions: Bay Area 3.05%, Los Angeles and San Diego 3.47%, Inland Empire 5.06%, and Central Valley 5.54%.
The counties gaining population are concentrated in the Central Valley and Inland Empire, the same regions carrying the highest gross yields.
Insurance is now a material cost variable. The California FAIR Plan received approval for an average rate increase of roughly 29% effective October 15, 2026.
Table of Contents
California home values have stopped rising. Rents have not. Across the state, typical home values sit 0.4% below where they were a year ago, while the median California city saw asking rents climb 2.45%. That gap is doing something specific to investor returns: it is widening gross rental yields without any action from the investor.
The result is a state that no longer behaves as one market. Gross yields now run from 1.38% in Newport Beach to 6.91% in San Jacinto, a five-fold spread inside a single state. This analysis measures that spread using Zillow home value and rent data through June 30, 2026, identifies which California regions the numbers currently favour, and sets out the costs and constraints that determine whether a gross yield survives contact with reality.
If you are still deciding whether California belongs on your shortlist at all, the US real estate investment hub covers the wider market comparison.
California Investment Property Market Conditions in 2026
Home Values Have Stalled Rather Than Fallen
California’s typical mid-tier home value stood at $775,549 in June 2026. That is 0.4% lower than a year earlier and 2.5% below the peak of $795,046 reached in January 2025.
Two conclusions get drawn from that figure, and both are wrong. The first is that California is in a correction. It is not. A 2.5% retreat from peak after a 38.3% run since January 2020 is a plateau, not a decline. The second is that California continues to compound at the rate it managed between 2020 and 2022. It does not. Values are up 16.8% over five years, and effectively all of that gain landed in the first two of those years.
California also is not an outlier. Ranked against all 50 states and the District of Columbia on year-over-year value change, California sits 11th from the bottom, in the same cooling group as Florida (down 2.8%), Nevada (down 2.1%), Colorado (down 2.0%), Texas (down 1.9%) and Arizona (down 1.6%). Several markets commonly recommended to international investors as alternatives to California are currently softening faster than California is.
For an investor, a flat value market is not automatically bad news. It removes appreciation from the return calculation and puts the weight on rental income, which is exactly where the second half of the data becomes interesting.
Rents Are Now Outpacing Values
Across 198 California cities with sufficient data, the median city recorded rent growth of 2.45% over the year to June 2026 against value growth of 0.27%.
The arithmetic consequence matters more than either number. Gross rental yield is annual rent divided by property value. When the numerator rises and the denominator does not, yields expand. California investors who bought two years ago are earning a better gross yield today than they underwrote, not because they did anything, but because the denominator stopped moving.
Statewide, the median California city gross yield now sits at 3.90%.
How California Compares to the Sunbelt Right Now
This is the finding most likely to contradict what an international investor has been told.
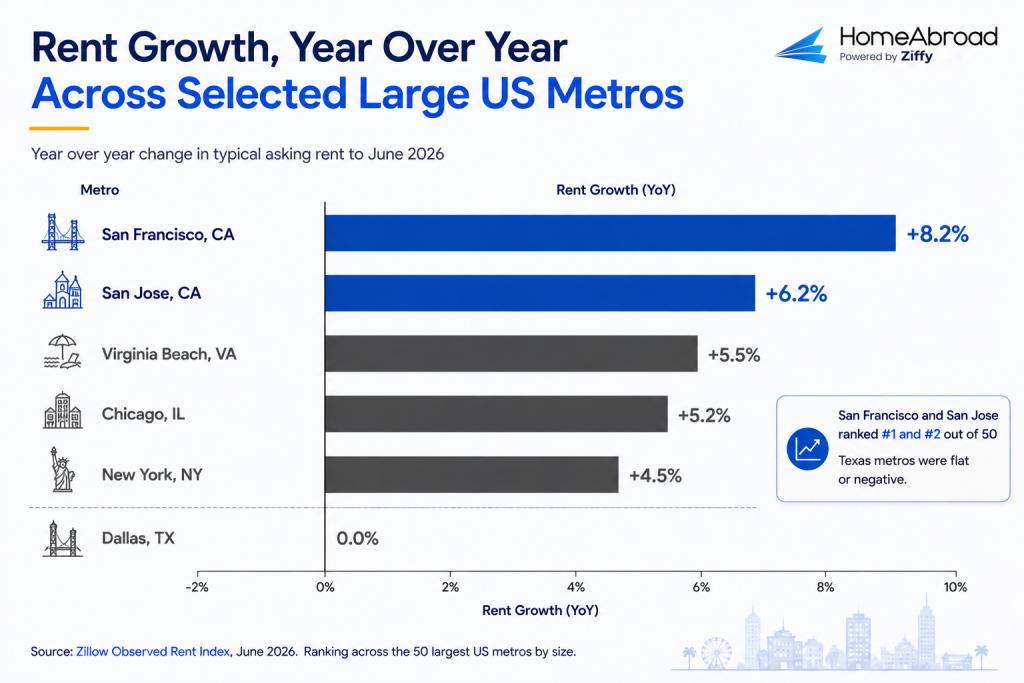
Metro | Typical asking rent | Rent growth, year to June 2026 |
|---|---|---|
San Francisco, CA | $4,539 | +8.2% |
San Jose, CA | $3,527 | +6.2% |
Virginia Beach, VA | $2,076 | +5.5% |
Chicago, IL | $2,395 | +5.2% |
New York, NY | $4,170 | +4.5% |
Dallas, TX | $1,605 | 0.0% |
Source: Zillow Observed Rent Index, June 2026. Ranking across the 50 largest US metros by size.
San Francisco and San Jose recorded the two fastest rent-growth rates among the 50 largest US metros. Dallas, the Texas metro shown here, was flat over the same period.
This does not mean California outperforms Texas as an investment. Entry cost, gross yield level, property tax treatment and rent regulation still favor Sunbelt markets on their own terms, and a single year of rent growth is a poor basis for a decade-long holding decision.
What it does mean is that the reasoning most commonly used to steer foreign investors away from California, that its rents have stagnated while cheaper states grow, is not supported by the current data. The premise needs rechecking, even if the conclusion ultimately remains the same.
Where California Rents Are Growing and Why
The San Francisco Rent Recovery
San Francisco city asking rents rose in every single month from January 2025 through June 2026.
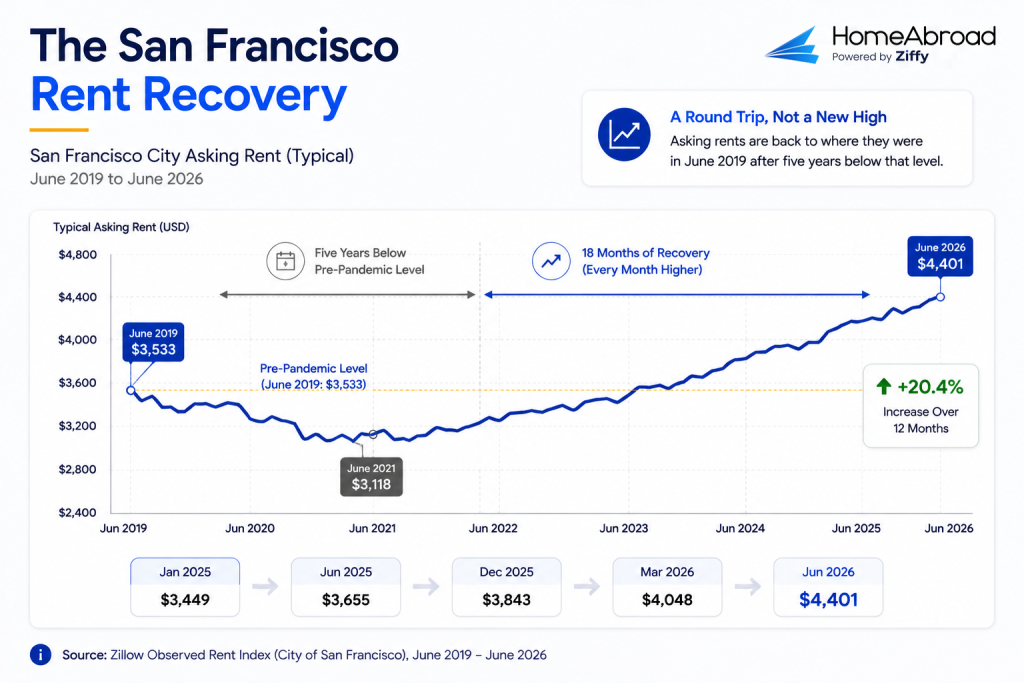
Month | Typical asking rent |
|---|---|
January 2025 | $3,449 |
June 2025 | $3,655 |
December 2025 | $3,843 |
March 2026 | $4,048 |
June 2026 | $4,401 |
That is a 20.4% increase over twelve months. Context is essential here: San Francisco asking rents were $3,533 in June 2019 and fell to $3,118 by June 2021. The city spent roughly five years below its pre-pandemic rent level. What the last eighteen months represent is the completion of a round trip, not an unprecedented surge into new territory.
One important qualifier. This index measures asking rents on newly listed units. It does not describe what happened to a sitting tenant’s rent, which in most cases is capped well below this figure by state law. An investor should read 20.4% as a repricing of vacant units, not as achievable growth on an occupied property.
The driver is now reasonably well documented. The San Francisco Controller’s Office attributes the city’s economic turnaround largely to artificial intelligence investment, with the city’s chief economist stating that AI is the main reason San Francisco rents are growing faster than in other places.
Office vacancy has fallen from a pandemic-era peak above 35% to just above 30%, dropping 3.7 percentage points in a year. CBRE reports that both San Francisco and Silicon Valley have more than five million square feet of active tenant demand from technology and AI firms.
There is a caution buried in the same source. The Controller’s Office notes that job growth outside healthcare and tourism has been modest, and that AI investment appears to be driving rents faster than it is driving employment. Rent growth running ahead of job growth is not a durable pattern. Any investor underwriting Bay Area rents on the last twelve months should treat the trajectory as investment-led rather than payroll-led, and size the position accordingly.
Inland Rent Growth Is Slower but Steadier
The inland markets tell a different story. Inland Empire cities recorded median rent growth of 2.5% and Central Valley cities 2.0%, against 4.8% in the Bay Area.
Over five years the ranking reverses. Bakersfield metro rents are up 33.5% since June 2021, Salinas 33.9%, Santa Maria 33.6% and Visalia 29.4%. San Francisco metro managed 24.5% over the same period, and much of that was recovering ground it had already lost.
Inland California did not participate in the coastal collapse and is not participating in the coastal rebound. For an income-focused investor, that stability is the point.
The Four Californias: A Yield Map for Investors
California is better understood as four distinct investment markets that happen to share a state government.
Region | Median home value | Median asking rent | Median gross yield | Rent growth | Value change |
|---|---|---|---|---|---|
Bay Area | $1,257,281 | $3,207 | 3.0% | +4.8% | −1.6% |
San Diego | $994,682 | $3,054 | 3.6% | +1.8% | +1.1% |
Inland Empire | $586,544 | $2,613 | 5.0% | +2.5% | −0.0% |
Central Valley | $428,837 | $1,989 | 5.5% | +2.0% | −0.4% |
Los Angeles | $946,268 | $2,773 | 3.5% | +1.8% | +1.1% |
Investment Properties Listed Today on Sale in California
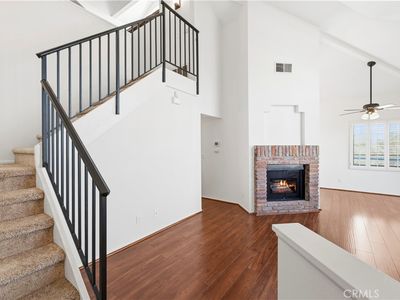


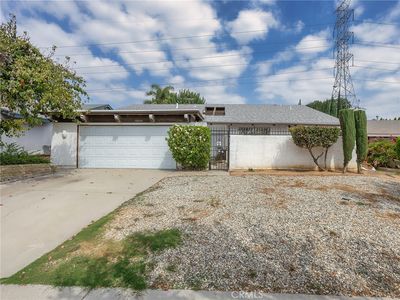
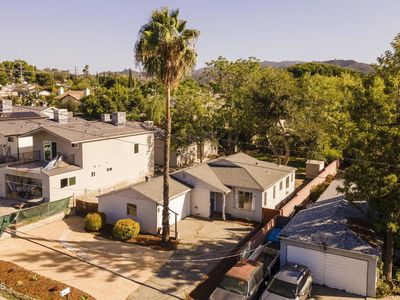
How to read these yields: Gross yield is annual asking rent divided by typical home value. It does not deduct property tax, insurance, homeowners association dues, vacancy, letting fees, management, maintenance or mortgage payments.
Net yield after those costs will be materially lower, and in California the gap between gross and net is wider than in most states because of insurance and tax treatment covered further down. Use these figures to compare markets against each other, not to forecast what a specific property will pay you.
Coastal California: Low Yield, High Absolute Rent
The coastal metros produce the state’s highest rents in absolute terms and its lowest yields.
Newport Beach returns a gross yield of 1.38% on a typical value of $3.73 million. Palo Alto returns 1.43%, Cupertino 1.67%, Sunnyvale 2.21%, Santa Monica 2.49%.
A sub-2% gross yield has a plain meaning for a financed buyer. Before a single operating cost is deducted, the rent does not come close to covering debt service at any interest rate available in 2026. These are not cash-flow assets. The investment case rests on capital preservation, currency positioning and long-run appreciation, and an investor buying here should be explicit that they are accepting negative monthly cash flow in exchange for those things.
Inland Empire and Central Valley: Where the Yield Is
City | Region | Typical value | Asking rent | Gross yield |
|---|---|---|---|---|
San Jacinto | Inland Empire | $484,772 | $2,793 | 6.91% |
Madera | Central Valley | $428,837 | $2,344 | 6.56% |
Palmdale | Los Angeles County | $505,741 | $2,720 | 6.45% |
Hanford | Central Valley | $384,771 | $2,053 | 6.40% |
Perris | Inland Empire | $544,654 | $2,833 | 6.24% |
Tulare | Central Valley | $359,149 | $1,849 | 6.18% |
Lancaster | Los Angeles County | $467,567 | $2,403 | 6.17% |
Indio | Inland Empire | $513,884 | $2,616 | 6.11% |
Victorville | Inland Empire | $437,583 | $2,227 | 6.11% |
Fresno | Central Valley | $392,929 | $1,954 | 5.97% |
Source: Zillow, June 2026. Yields are gross and exclude all operating costs.
Tenant pools are thinner. A vacancy in Fresno or Victorville takes longer to fill than a vacancy in Santa Ana, and for an owner nine time zones away, marketing time converts directly into lost income. Several of these markets depend heavily on a small number of regional employers, so employment risk is concentrated rather than diversified.
In the desert markets, Indio, Palm Desert and Victorville among them, summer cooling costs are high enough to affect tenant retention and to become a negotiating point at renewal. And property management is not optional at this distance, which removes roughly 8% to 10% of gross rent before anything else is paid.
None of that eliminates the yield advantage. It does mean a 6.9% gross yield in San Jacinto and a 3.84% gross yield in Santa Ana are separated by only about 3 percentage points, before accounting for vacancy, management, insurance, taxes and other operating costs.
Oakland: What a 20% Value Reset Did to Yield
Oakland is the most instructive single market in the dataset.
Typical home values fell 4.6% over the past year and 20.1% over five years, to $721,966. Over the same five years, asking rents rose 11.6%, and over the past year they rose 7.8% to $2,614. The gross yield now sits at 4.34% against a Bay Area median of 3.05%.
That is yield expansion arriving entirely through the denominator. The rent did not surge. The price collapsed.
Whether that constitutes an opportunity depends on a question the yield cannot answer: is the cause cyclical or structural? The evidence points both ways. Oakland sits across the bay from the strongest office recovery in the country, and rent growth of 7.8% suggests tenant demand is intact.
Against that, downtown Oakland office vacancy rose over the past year, from 30.3% to 32.3%, at the same time that San Francisco’s was falling and Silicon Valley’s dropped to 14.1%. The AI leasing wave lifting San Francisco has so far flowed south to Silicon Valley rather than east across the bay.
An investor buying Oakland at today’s yield is buying the possibility that the wave eventually crosses the water. That is a defensible position. It is a speculative one, and it should be held with that label attached.
Appreciation or Cash Flow: California Forces the Choice
The relationship between five-year appreciation and current yield is close to inverse across the state.
City | Five-year value growth | Gross yield |
|---|---|---|
Irvine | +62.7% | 2.65% |
Newport Beach | +61.9% | 1.38% |
Laguna Niguel | +57.6% | 2.61% |
San Clemente | +50.6% | 2.36% |
Richmond | −8.2% | 4.90% |
Oakland | −20.1% | 4.34% |
Orange County’s coastal cities delivered the strongest appreciation in the state and its weakest income. The East Bay delivered the reverse. California does not currently offer a market that does both well, and any article suggesting otherwise is describing a property rather than a market.
That leaves three coherent positions:
Income priority: Central Valley and Inland Empire. Gross yields of 5% to 7%, entry costs under $500,000, and the state’s weakest appreciation record. Suits an investor who needs the property to pay for itself and is indifferent to capital growth.
Balanced: Sacramento at 5.15% gross, Fresno at 5.97%, and the inner Inland Empire cities. Moderate on both axes, with deeper tenant pools than the outer valley markets.
Capital preservation and appreciation priority: Coastal metros at gross yields below 3.5%. Negative monthly cash flow is likely at current financing costs. Suits an investor whose primary objective is holding value in US dollars in a supply-constrained market, with rental income as partial offset rather than as the return.
There is no best answer among these. The five-year appreciation figures in the table above describe what already happened and carry no information about what happens next.

Michele Lawrie
Real Estate Consultant (NY #10311209401)
HomeAbroad
For international investors, moving inland usually changes the investment equation from appreciation-led to income-led. Lower acquisition costs and stronger rental yields can improve cash flow, but I always evaluate tenant demand, property management, insurance, and resale liquidity before calling a higher-yield market the better choice.
Entry Cost for International Buyers
The capital required to enter California varies more within the state than most international investors expect.
City | Typical value | 25% down payment | Monthly asking rent |
|---|---|---|---|
Bakersfield | $392,105 | $98,026 | $1,865 |
Fresno | $392,929 | $98,232 | $1,954 |
Sacramento | $482,968 | $120,742 | $2,071 |
San Jacinto | $484,772 | $121,193 | $2,793 |
Los Angeles | $949,479 | $237,370 | $2,773 |
San Francisco | $1,395,852 | $348,963 | $4,401 |
A Bakersfield entry sits near $98,000 of equity. A San Francisco entry sits near $349,000. That is a 3.6-fold difference within one state, and it is the clearest argument against treating “California” as a single decision. The Bakersfield buyer and the San Francisco buyer are running different businesses.
Supply, Population, and Tenant Demand
California’s Population Is Flat, but Not Everywhere
The California Department of Finance reported that the state’s population fell by roughly 54,000 between January 2025 and January 2026, to just under 39.6 million. Net international migration halved in a single year, from 248,400 in 2024 to 126,400 in 2025, while net domestic out-migration reached 288,600 in 2025.
That is the headline most international investors have encountered, and taken alone it argues against California entirely.
The county detail argues something more specific. The same Department of Finance report states that population increased in 17 counties, with most of the growth concentrated in the Central Valley and the Inland Empire.
Those are the same regions carrying the state’s highest gross yields.
The overlap is worth stating precisely, because it is easy to overclaim. It supports the view that tenant demand in the Central Valley and Inland Empire has a demographic floor under it, which is a reasonable thing for an income investor to want. It does not forecast rent growth, and it does not mean coastal California is emptying. People leaving Los Angeles County for Riverside County remain California renters. What has changed is which California markets they rent in.

Steven Glick
Director of Mortgage Sales · HomeAbroad
We’re seeing strong interest from international investors in the Inland Empire and Central Valley, where lower entry costs can make rental cash flow more workable. Coastal markets still attract investors focused on long-term appreciation.
Housing Supply and Population Trends
California has legislated repeatedly on supply. Senate Bill 9 allows qualifying single-family lots to be split or converted to duplexes in many jurisdictions, and successive accessory dwelling unit laws have made it substantially easier to add a second unit to an existing parcel.
For an investor, the relevant implication is not development. It is that a California single-family parcel may carry more permitted density than its current use suggests, which affects both long-run value and the competitive supply picture in a given submarket. Local implementation varies widely, and several cities have narrowed the practical effect through design and permitting requirements.
Costs and Constraints That Change California Returns
Every gross yield quoted above is reduced by what follows. In California the reductions are larger and more variable than in most states, which is why the gross figure alone is a poor basis for a decision.
Property Taxes Under Proposition 13
California property tax is governed by Proposition 13, passed in 1978. The base rate is 1% of assessed value, plus voter-approved local levies that vary by district and commonly bring the effective rate to somewhere between 1.1% and 1.3%. Annual increases in assessed value are limited to 2%.
The mechanic that matters to a buyer is the reassessment on change of ownership. When a property changes hands, its assessed value resets to the purchase price. A long-held California property may be assessed far below market value, and the listing’s current tax figure will not be the figure you pay. Model your property tax on your purchase price, not on the seller’s assessment.
On a $500,000 Inland Empire purchase, an effective rate of 1.2% is roughly $6,000 a year, which is around 250 basis points of gross yield on a property yielding 6%. Property tax alone converts a 6% gross yield to something closer to 3.5% before insurance, management or vacancy.
Insurance Availability and the FAIR Plan
Insurance has become a major variable in California rental budgets. For an international investor, it is also one of the costs easiest to overlook when modeling a property remotely.
The California FAIR Plan, the state’s insurer of last resort for owners who cannot obtain private coverage, received approval for an average statewide rate increase of approximately 29%, effective October 15, 2026, affecting more than 675,000 policyholders. The impact varies significantly by ZIP code. Some wildfire-exposed properties could see premiums rise sharply, while lower-risk urban areas may see smaller increases or even decreases.
Two things matter for investors.
First, insurance costs can vary at the ZIP code and parcel level. Two properties just minutes apart can have very different premiums. A market-level yield table cannot capture that difference.
Second, higher insurance costs can reduce the net yield of inland and desert properties that otherwise show attractive gross yields. A 6.9% gross yield with a FAIR Plan policy can produce a very different return from the same yield with standard private coverage.
There is also a positive signal. FAIR Plan enrollment growth has slowed, with roughly 16,000 residential policies added in the first quarter of 2026 compared with 35,000 to 50,000 per quarter during the preceding two years. Several private carriers have also committed to expanding California coverage under the state’s Sustainable Insurance Strategy.
Rent Regulation and Tenant Protections
California’s Tenant Protection Act, AB 1482, caps annual rent increases on covered properties at 5% plus the regional change in the consumer price index, to a hard maximum of 10%. The regional figures reset each August 1. The law also imposes just cause requirements on ending a tenancy, and it is currently scheduled to remain in effect through January 1, 2030.
Certain properties are exempt, and a number of cities including Los Angeles, San Francisco, Oakland, Berkeley and Richmond operate their own rent stabilisation ordinances that are stricter than the state cap and take precedence where they apply.
The practical consequence for an investor is that the market rent movements described earlier in this analysis apply to units being newly let, not to increases on sitting tenants. Coverage status, exemption status and local ordinance all need to be established for a specific address before any income projection is built.
Other Cost Inputs
Homeowners association dues apply to most condominium and many planned-development properties and can run several hundred dollars a month. Older coastal housing stock may carry seismic retrofit obligations. Central Valley markets face water cost pressure in drought years. Desert markets carry high summer cooling loads that fall on the tenant but affect retention and, at the margin, achievable rent.
Risks That Could Change the California Investment Case
These are conditions to monitor, with an indicator attached to each. None of them is a forecast.
Rent growth is concentrated in two metros: The state’s headline rent performance rests on San Francisco and San Jose. If Bay Area technology employment softens, the statewide figure falls with it, and the AI investment driving the current cycle is running ahead of actual job creation. Watch: California Employment Development Department industry employment data for the San Francisco and San Jose metro divisions.
Value stagnation may persist: Values sit 2.5% below the January 2025 peak with no obvious catalyst for a return. A flat five years is a plausible scenario, and it removes the entire investment case for the sub-3% yield coastal markets. Watch: monthly typical home value against the January 2025 peak.
Insurance costs may keep escalating: The October 2026 FAIR Plan increase is the largest in the plan’s recent history, and its exposure has grown sharply. Watch: California Department of Insurance rate filings and FAIR Plan policy counts.
Population and international migration: Net international migration halved in one year. Continued decline would weaken tenant formation, particularly in markets dependent on new arrivals. Watch: Department of Finance E-1 report, published each spring.
Regulation may tighten: Rent caps and local ordinances change through both legislation and ballot measures, and AB 1482 is scheduled for review before 2030. Watch: state legislative sessions and municipal ballot measures.
Wildfire risk may reprice entire submarkets: Hazard designation affects insurance availability, financing and resale liquidity simultaneously.

Rising insurance costs can materially change a property’s monthly housing payment and DSCR. Before committing to a California property, investors should get an actual insurance quote and model taxes, insurance, and rent together to see whether the deal still works.
How Foreign Investors Finance California Rental Property
Most international investors buying US rental property do not finance it the way a US resident would, because the documentation a conventional loan typically requires, including US tax returns, US employment history, and an established US credit history, may not be available to them.
A DSCR loan, short for Debt Service Coverage Ratio, qualifies the borrower primarily based on whether the property’s rental income covers its housing payment. The ratio compares gross rental income to PITIA, which includes monthly principal, interest, property taxes, insurance, and any association dues. A DSCR of 1.0 means the property’s rental income exactly covers the calculated housing payment.
This is where the yield map and financing question meet. At coastal California gross yields below 3.5%, achieving DSCR coverage from rent alone can be difficult. Higher-yielding Inland Empire and Central Valley markets can provide more room for the property’s rental income to support financing.
HomeAbroad finances foreign national investors purchasing US rental property, including borrowers without an established US credit history, and offers a No-Ratio DSCR structure for eligible properties that do not meet the standard DSCR requirement.
A Representative HomeAbroad Client Scenario
A foreign investor was looking to purchase a rental property in Fresno but was unsure how to finance the investment without an established US credit history. After connecting with HomeAbroad, the investor explored a Foreign National DSCR Loan, which evaluates the property’s rental income and cash flow as a primary part of the qualification process.
The property had a purchase price of $425,000 and expected monthly rental income of $2,300. With a 25% down payment, the proposed loan amount was $318,750. After factoring in the property’s principal and interest, estimated property taxes, insurance, and other applicable housing costs, the calculated DSCR was 1.13.
A 1.13 DSCR means the property’s qualifying rental income provided approximately 13% more coverage than the calculated monthly housing payment. For the investor, this created a financing path centered on the property’s income rather than requiring traditional US employment income or an established US credit history.
This shows how DSCR financing can give foreign investors another way to evaluate California rental properties, particularly in markets where rental income is strong relative to property values.
Get a rate quote from HomeAbroad for the California market you’re evaluating and see how the financing works for your investment property.
Frequently Asked Questions
Is California a good market for foreign investors right now?
It depends on what you need the property to do. If you need rental income to cover the property’s costs, the Central Valley and Inland Empire currently offer gross yields of 5% to 7% at entry costs under $500,000. If you are prioritising capital preservation in a supply-constrained market and can accept negative monthly cash flow, the coastal metros suit that objective at gross yields below 3.5%. California does not currently offer both in the same property.
Which California cities have the highest rental yields?
As of June 2026, San Jacinto leads at 6.91% gross, followed by Madera at 6.56%, Palmdale at 6.45%, Hanford at 6.40% and Perris at 6.24%. These are gross figures before property tax, insurance, management, vacancy and maintenance, all of which are material in California. Net yields will be substantially lower.
Are California home prices going to drop?
Values are currently 2.5% below their January 2025 peak and 0.4% lower than a year ago, so a modest decline has already occurred. We do not forecast prices. What the data supports is that the market has been flat for roughly eighteen months, that eleven other states have seen larger year-over-year declines, and that a continued plateau is at least as plausible as either a recovery or a fall.
How much capital do I need to buy a California rental property?
The range within the state is wide. At an illustrative 25% down payment, entry equity runs from roughly $98,000 in Bakersfield or Fresno to roughly $349,000 in San Francisco. Actual down payment requirements depend on the loan program, the property and the borrower, and closing costs, reserves and initial insurance are additional.
Why are San Francisco rents rising so quickly?
The San Francisco Controller’s Office attributes the city’s rent growth largely to artificial intelligence investment, with office vacancy falling from above 35% to just above 30% over the past year. Two qualifiers matter. The figures describe asking rents on newly listed units rather than increases on existing tenancies, and the city’s own economist has noted that rents are rising faster than employment, which is not a durable pattern.
What are the main risks of investing in California property?
Insurance cost and availability, which vary by wildfire exposure at the parcel level and are rising sharply. Rent regulation under AB 1482 and stricter local ordinances, which cap what you can charge a sitting tenant. Value stagnation, which removes appreciation from the return. And the concentration of the state’s rent growth in two technology-dependent metros.